View of the sun: This image is a superimposition of two images, taken using the Nuclear Spectroscopic Telescope Array in the x-ray range (NuSTAR, green and blue) and the Solar Dynamics Observatory in the ultraviolet range (SDO, reddish). Here, gas is visible with temperatures between 1 and 3 million degrees. In the spectrally fragmented x-rays, the emission lines 3C and 3D of Fe XVII are dominant, as are B and C of Fe XVI.
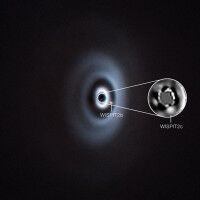
In future it will be possible to incorporate data from deep space telescopes into the underlying atomic models with a high degree of reliability. View of the sun: This image is a superimposition of two images, taken using the Nuclear Spectroscopic Telescope Array in the x-ray range (NuSTAR, green and blue) and the Solar Dynamics Observatory in the ultraviolet range (SDO, reddish). Here, gas is visible with temperatures between 1 and 3 million degrees. In the spectrally fragmented x-rays, the emission lines 3C and 3D of Fe XVII are dominant, as are B and C of Fe XVI. NASA /JPL-Caltech - Very hot gas, as found in the sun's corona or in close proximity to black holes, emits very intense x-rays. It reveals the locally prevailing physical conditions, such as temperature and density. But there is one problem that researchers have been battling with for decades: the intensity rates of important emission lines of iron measured in the laboratory do not match those calculated.
UM DIESEN ARTIKEL ZU LESEN, ERSTELLEN SIE IHR KONTO
Und verlängern Sie Ihre Lektüre, kostenlos und unverbindlich.
Ihre Vorteile
- Zugang zu allen Inhalten
- Erhalten Sie Newsmails für Neuigkeiten und Jobs
- Anzeigen veröffentlichen